Case study
Panerai Homepage — Core Web Vitals Audit
The LCP hero image downloads in 0.15ms but takes 12 seconds to appear in the lab — because the browser doesn't know it exists until 1.6MB of JavaScript finishes executing.
Audited panerai.com/pl/en/home.html
This is a public case study from my audit playbook — the Panerai homepage. Panerai is a real, commercial luxury-watch site, and I picked it for a simple reason: I like their watches, and I wanted to work through the real problems that production websites actually have, not a contrived demo.
The headline finding, in one line: the LCP hero image downloads in 0.15ms but takes 12 seconds to appear in lab conditions — because the browser doesn’t know it exists until 1.6MB of JavaScript finishes executing.
This is one of the most common LCP bugs on the web — a hero image lazy-loaded by JavaScript that the preload scanner can’t see. Panerai just demonstrates it unusually clearly. It’s a discovery problem, not a download problem: you could put this image on the fastest CDN on earth and it wouldn’t move the needle by a millisecond, because the browser doesn’t even know to request it until JavaScript runs ~12 seconds in. This case study traces that bug on a luxury retail homepage, and how the same heavyweight-JS root cause ripples into INP and ~5 MB of unused code.
Site & Date
- Site/Page audited: panerai.com/pl/en/home.html
- Date: 2026-07-22
- Auditor: Mykyta Shaban
Tools & Conditions
- Host machine: Apple M2 Pro, 32 GB RAM — DevTools CPU throttling is a multiplier on the host CPU, so “6x” here simulates a mid-tier mobile; on a slower host the same setting would be harsher. Documented so the lab numbers are reproducible.
- Device emulation: iPhone 12 Pro, 390x844, 3x DPR
- CPU throttling: 6x slowdown
- Network throttling: Slow 4G
- Data sources used: PageSpeed Insights (CrUX field data), Chrome DevTools Performance panel, Network panel, ct.css bookmarklet, Lighthouse diagnostics
- Methodology: PSI for CrUX field data first. Manual Performance trace in normal browser profile (cookies accepted, cookie banner bypassed). Network panel filtered by CSS and JS for blocking resource analysis. ct.css for head order audit.
Executive Summary
- LCP 2.9s ⚠️ — hero image is lazyloaded via
data-src, so the browser can’t discover it until JS runs; the preload hint points at a different URL, so it doesn’t help. This is a discovery problem, not a download problem. - INP 262ms ⚠️ — burger menu handler runs 671ms of synchronous JS (717ms total interaction in lab); a reactive push-chain re-running on menu open dominates, all scripting rather than layout/paint
- Massive dead code —
libs.min.cssis 96% unused and ~4199 KiB of JS is unused (≈50/50 first-party bundles / third-party tags), driving TBT 9560ms and feeding INP
Baseline Measurements
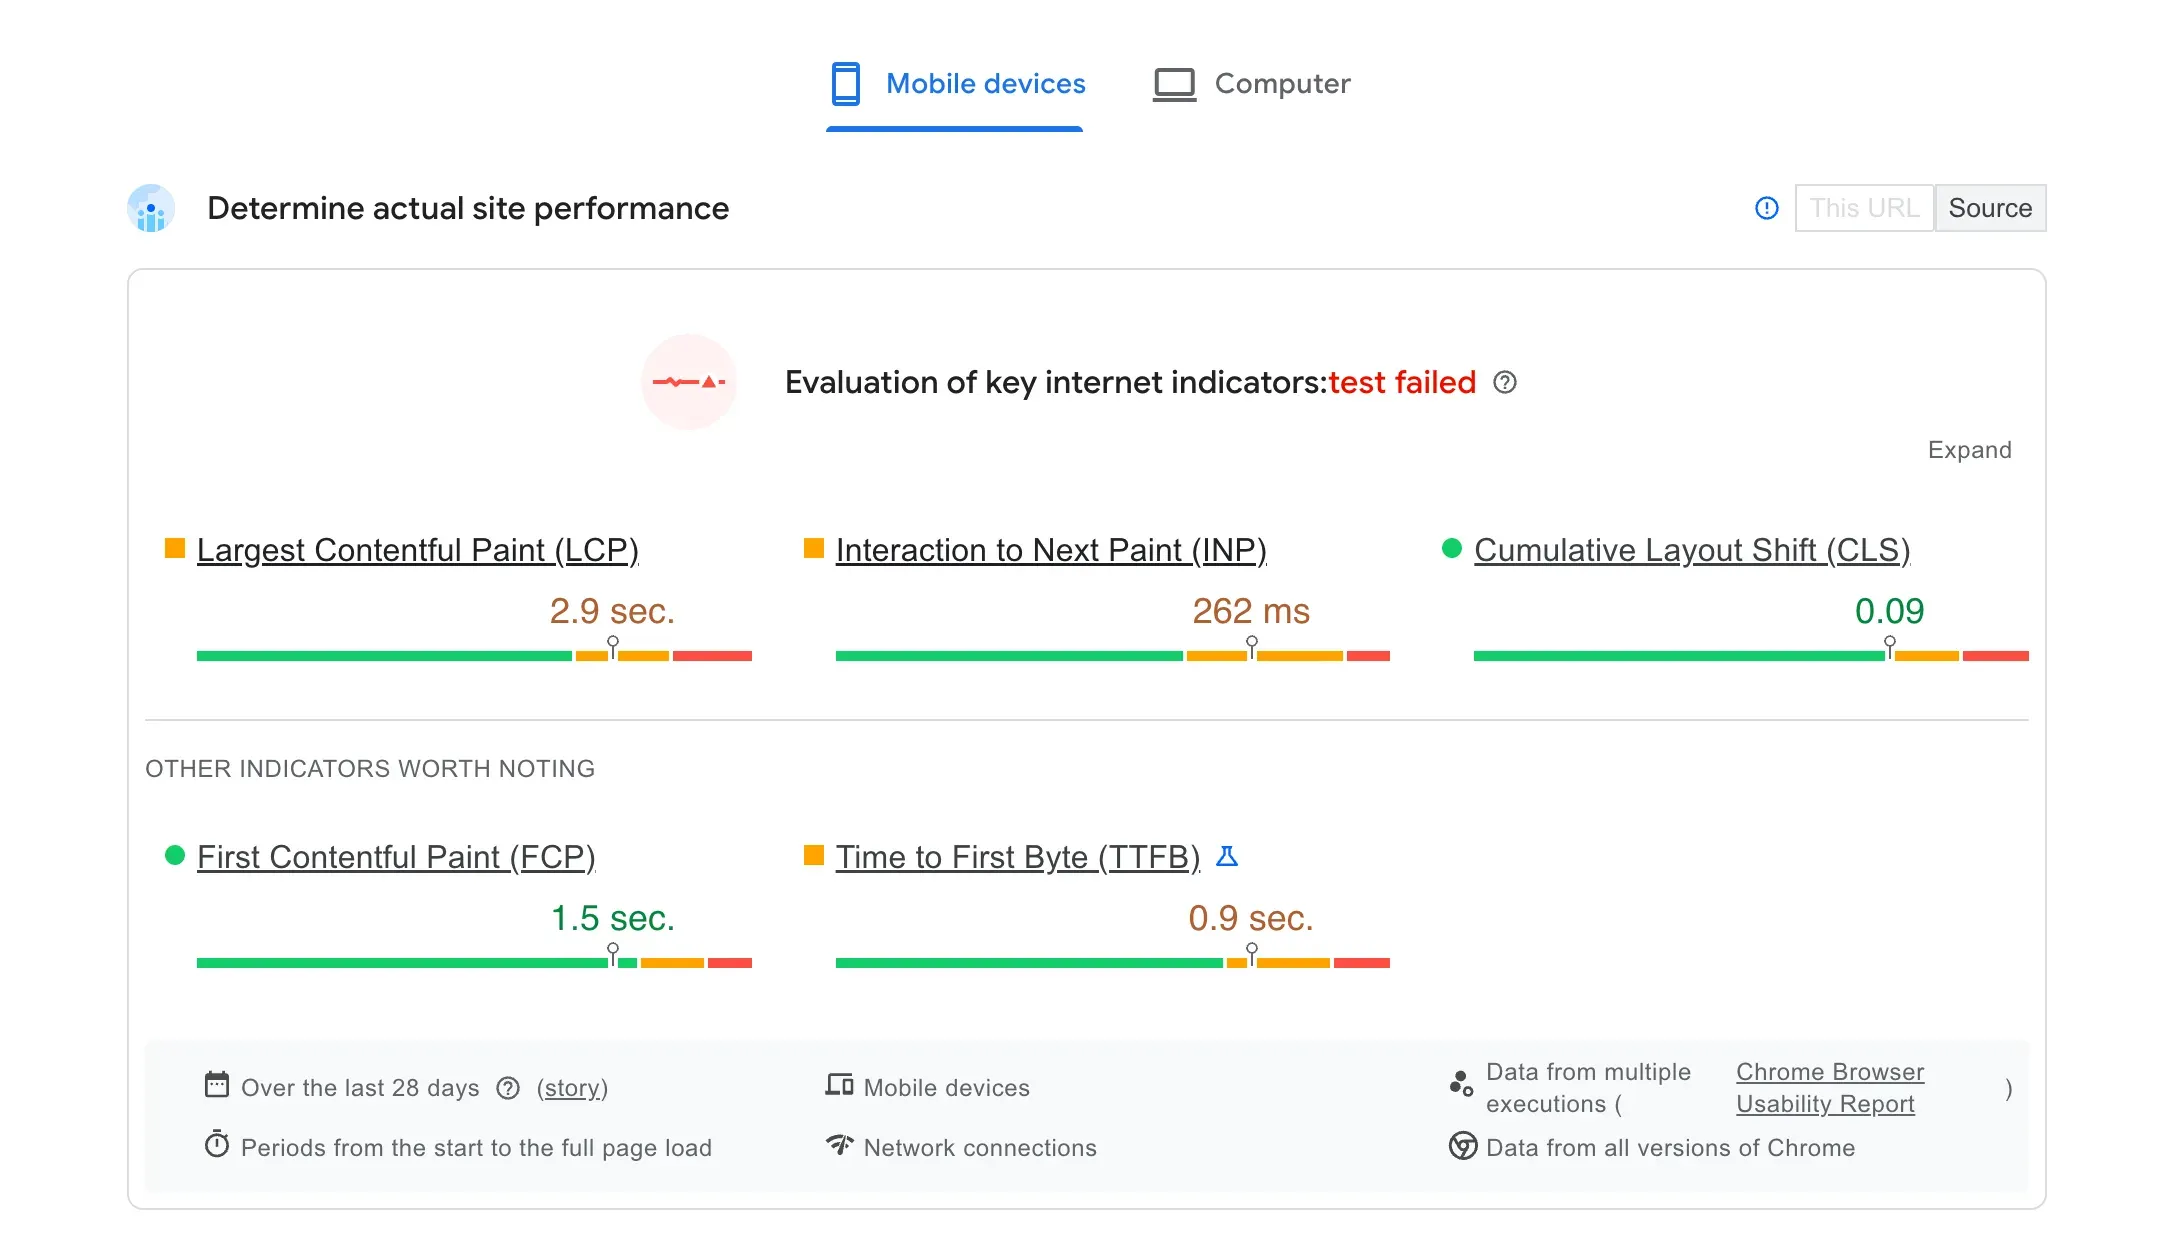
CrUX field data is the primary source — it reflects real user experience. Lab values from the performance trace are for debugging, not for pass/fail judgement.
| Metric | Field / CrUX (p75) | Lab (6x CPU / Slow 4G) |
|---|---|---|
| LCP | 2.9s ⚠️ | 12.48s (median of 3) |
| CLS | 0.09 ✅ | 0.00 |
| INP | 262ms ⚠️ | 717ms |
Thresholds: LCP Good < 2.5s / NI < 4s / Poor ≥ 4s · CLS Good < 0.1 / NI < 0.25 · INP Good < 200ms / NI < 500ms
Findings
LCP

- What I observed: The LCP element is the hero image — the transformed variant
...transform.global_image_375_2x.png(elementimg.pan-heroslider-image.lazyloaded). Resource load delay is almost the entire LCP time (1179ms of a 1249ms LCP unthrottled; ~12s of the 12.48s median LCP under 6x/Slow4G — ~95% either way). Two separate things are going on:- The hero
<picture>/<img>in the HTML usedata-src/data-srcset, not realsrc/srcset— a JS lazyload pattern.libs.min.jsitself is requested early (right after the HTML, Medium priority), but it’s ~1.6 MB and parser-blocking, so it downloads and executes slowly (7.73s under throttle). Only when it finishes does it swapdata-src→srcand trigger the image. So the LCP image — a separate, later request withlibs.min.jsas its initiator and Low priority — fires very late. The image isn’t late because the JS started late; it’s late because the JS it depends on is huge and slow to finish. - There is a
<link rel="preload" as="image" fetchpriority="high">in the<head>— but it points at a different URL than the LCP element uses (the rawHPHero_Luminor_mob.jpg/HP_slider_..._D.jpgvs. the Akamai.transform.global_image_*.pngvariant the<img>actually renders). So the high-priority preload downloads an image the LCP element never uses, while the real LCP image gets no benefit.
- The hero
- Why it happens: This is a discovery problem, not a download problem. The LCP image itself downloads in ~0.15ms (cdn-cache HIT) — network speed, image size, and priority are all irrelevant. The entire delay is the browser waiting to find out the image exists: the preload scanner can’t see
data-src, and the one real hint (the preload link) is aimed at the wrong URL.fetchpriorityonly matters once the browser decides to fetch a resource — here, discovery is gated behind JS execution, so there’s no request to prioritise untillibs.min.jsruns. (Background reading: how the preload scanner interacts with lazy-loading.) - Recommended fix: Let the preload scanner discover the real LCP image at T=0. Un-lazyload the first hero slide only — give its
<img>/<source>realsrc/srcset(notdata-*) plusfetchpriority="high", so the parser finds it immediately. Keep lazyloading on non-first slides / below-the-fold images. If keeping the preload link, fix it to match the responsive transformed variants withimagesrcset+imagesizes. - Estimated impact: High — resource load delay is ~95% of LCP and is entirely avoidable. Fixing discovery should collapse load delay to near-zero and push field LCP under the 2.5s Good threshold. Note:
fetchpriorityalone (the original recommendation) would not have fixed this — the image must first be discoverable.
CLS
- What I observed: CLS is 0.09 ✅ in field data and 0.00 in lab — within the Good threshold. No layout shifts worth investigating detected.
- Why it happens: N/A
- Recommended fix: No action needed. Monitor after any changes to the carousel, hero section, or cookie banner positioning.
- Estimated impact: N/A
INP
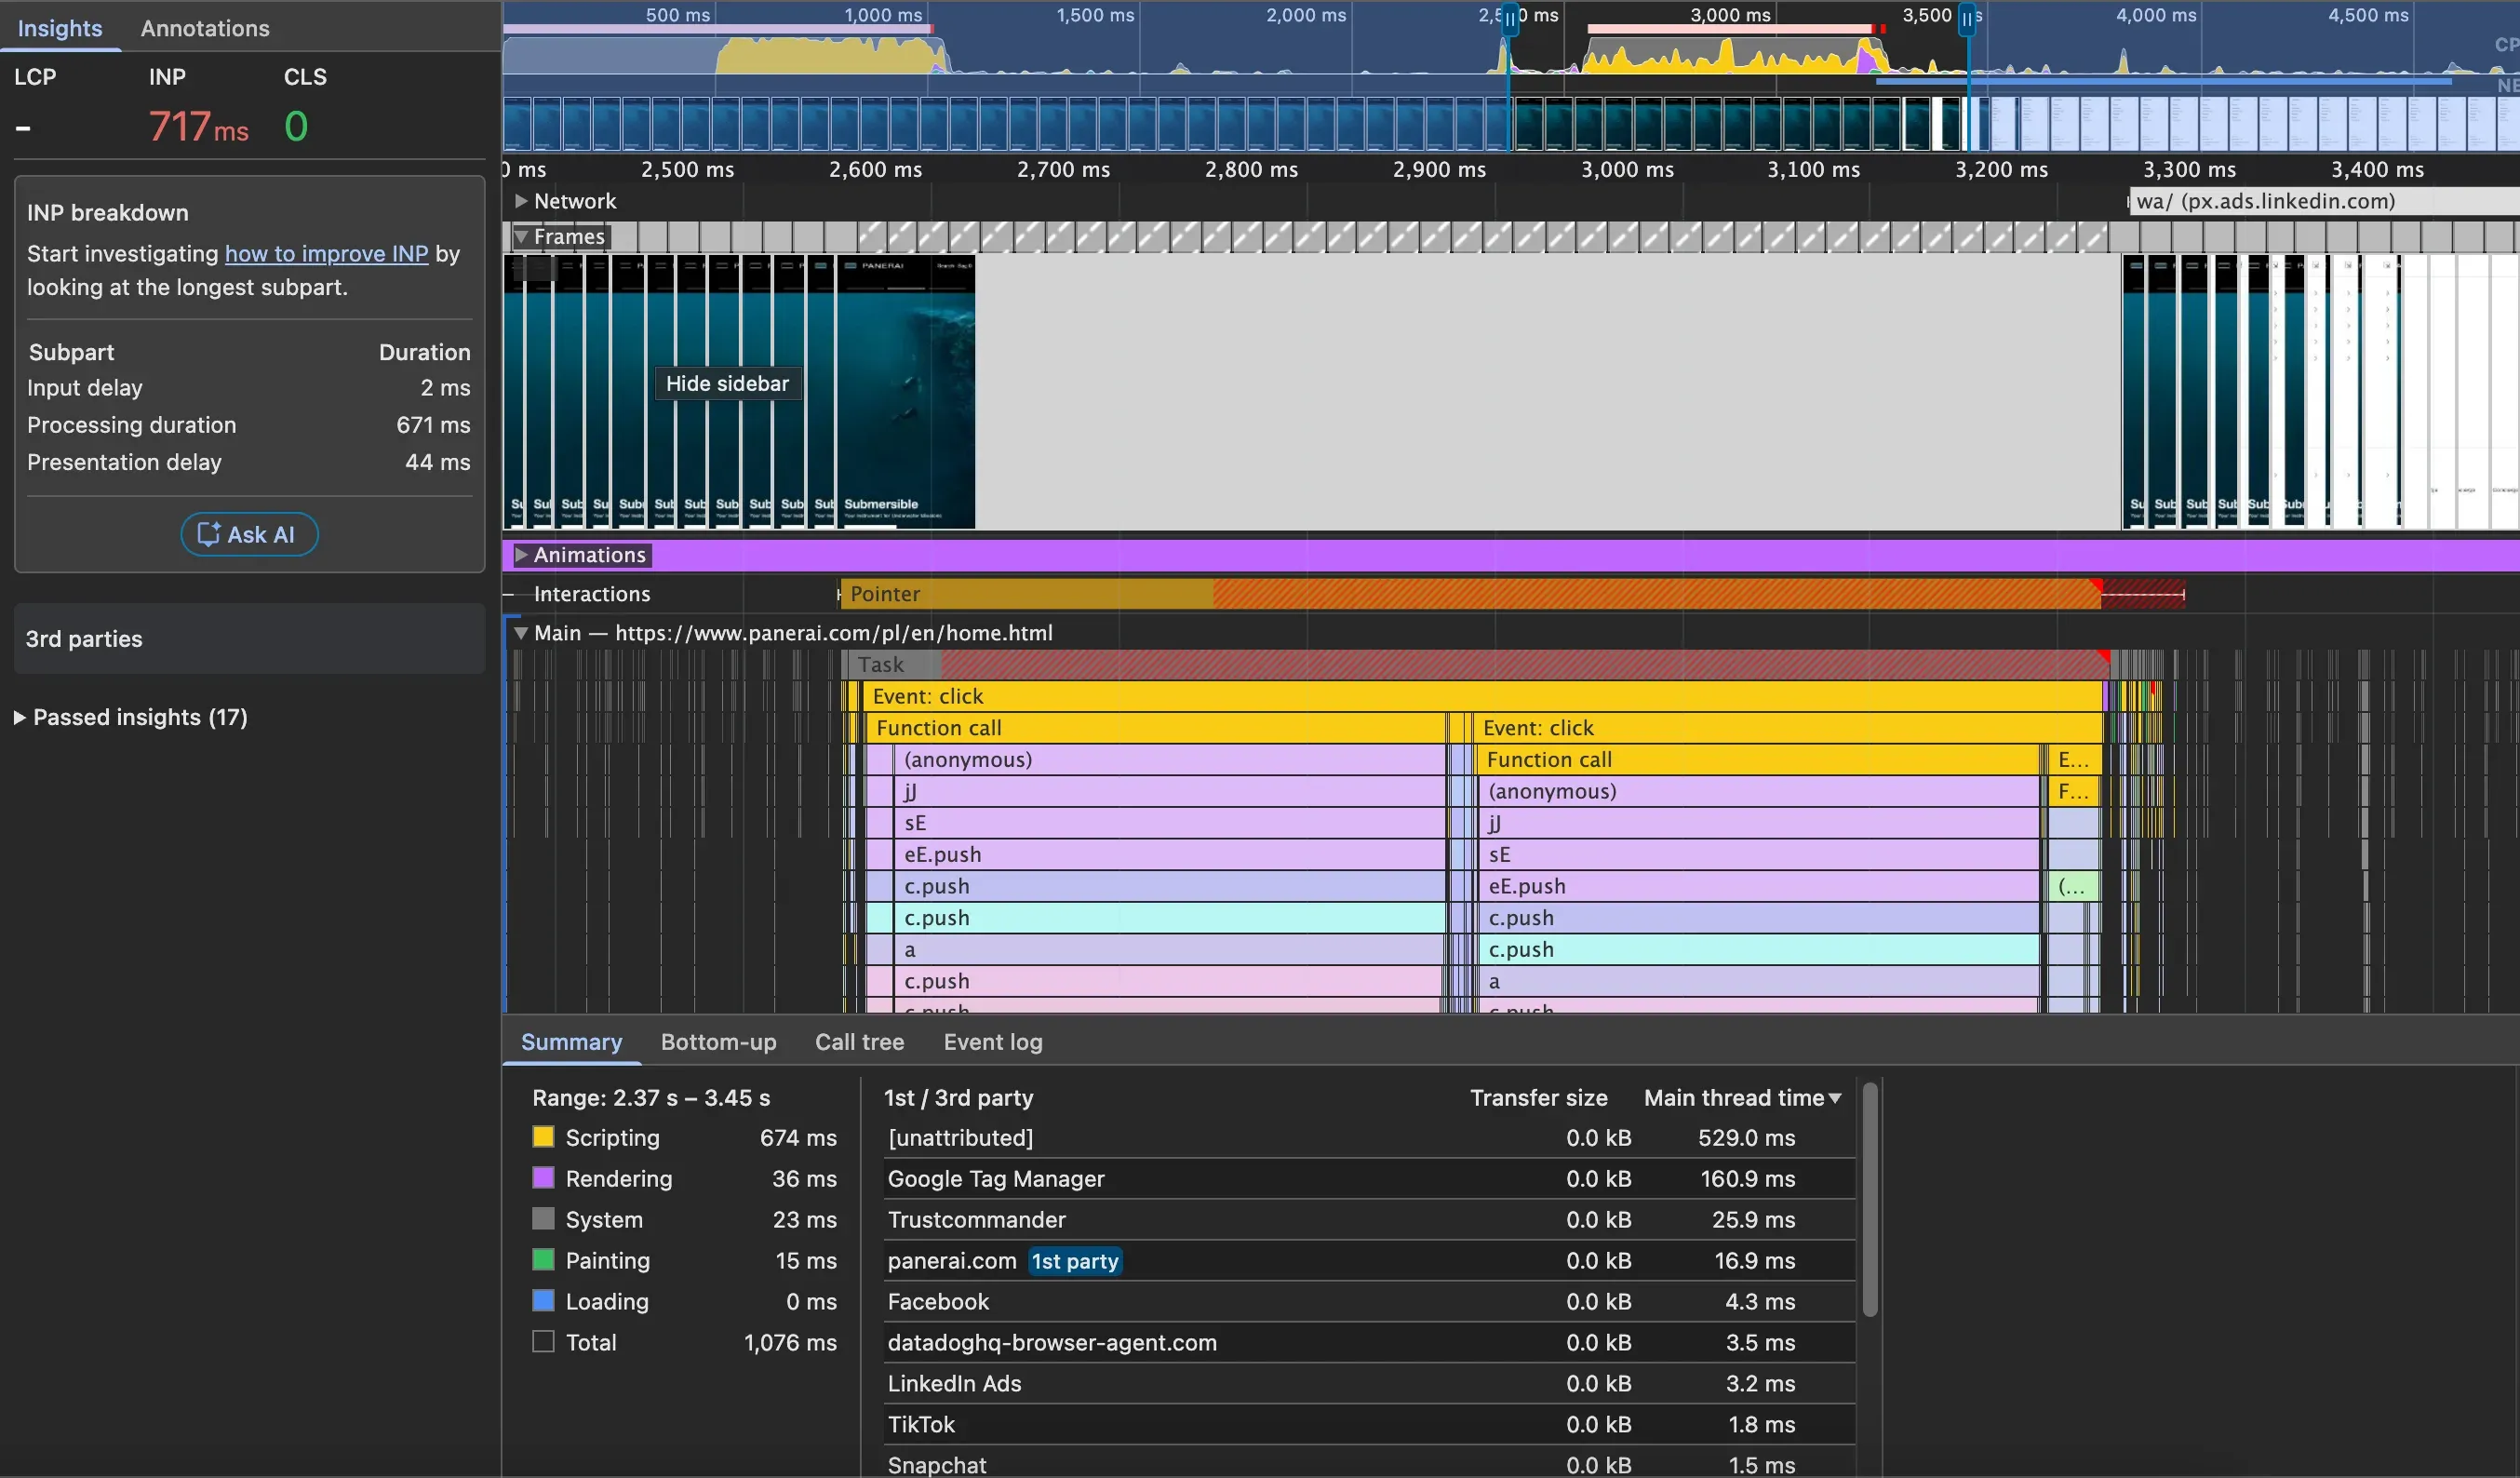
- What I observed: Clicking the burger menu (sidebar open) produces a 717ms interaction in lab (field INP p75: 262ms), reproducible across 4–5 runs. Phase breakdown: input delay 2ms + processing duration 671ms + presentation delay 44ms. Because this run was recorded on an idle main thread, input delay is ~0 — which cleanly isolates the handler’s own cost as the entire problem. The interaction window is almost entirely Scripting (674ms) versus Rendering 36ms and Painting 15ms, so the cost is JS execution, not layout or paint. The call stack shows a deep, repeated push-chain (
jJ → sE → eE.push → c.push → c.push …), consistent with a reactivity/observer system re-running synchronously on the state change. Google Tag Manager also consumes ~161ms of main-thread time in the same window. - Why it happens: The click handler runs ~671ms of synchronous JavaScript in a single long task. The repeated
.pushchain points to a reactive dependency/event-emitter system doing far more work than opening a menu should require. The near-zero input delay in this run proves the handler processing itself — not thread contention — is the dominant cost. (In earlier runs where the thread was busy at click time, input delay added ~326ms on top, so real-world INP can be worse than this clean measurement.) - Recommended fix: Profile the handler and break up the 671ms of synchronous work. Yield to the main thread (
scheduler.yield()/setTimeout) between chunks so one interaction isn’t one long task. Investigate the reactive push-chain — it’s likely re-running observers over more state than necessary on menu open. Separately, defer non-critical third-party work (GTM’s 161ms) out of the interaction path. - Estimated impact: High — processing duration alone (671ms) is 3x+ the 200ms Good threshold. Breaking the handler into smaller yielded tasks is required to pass INP, independent of the input-delay contention.
Loading / Network
- What I observed:
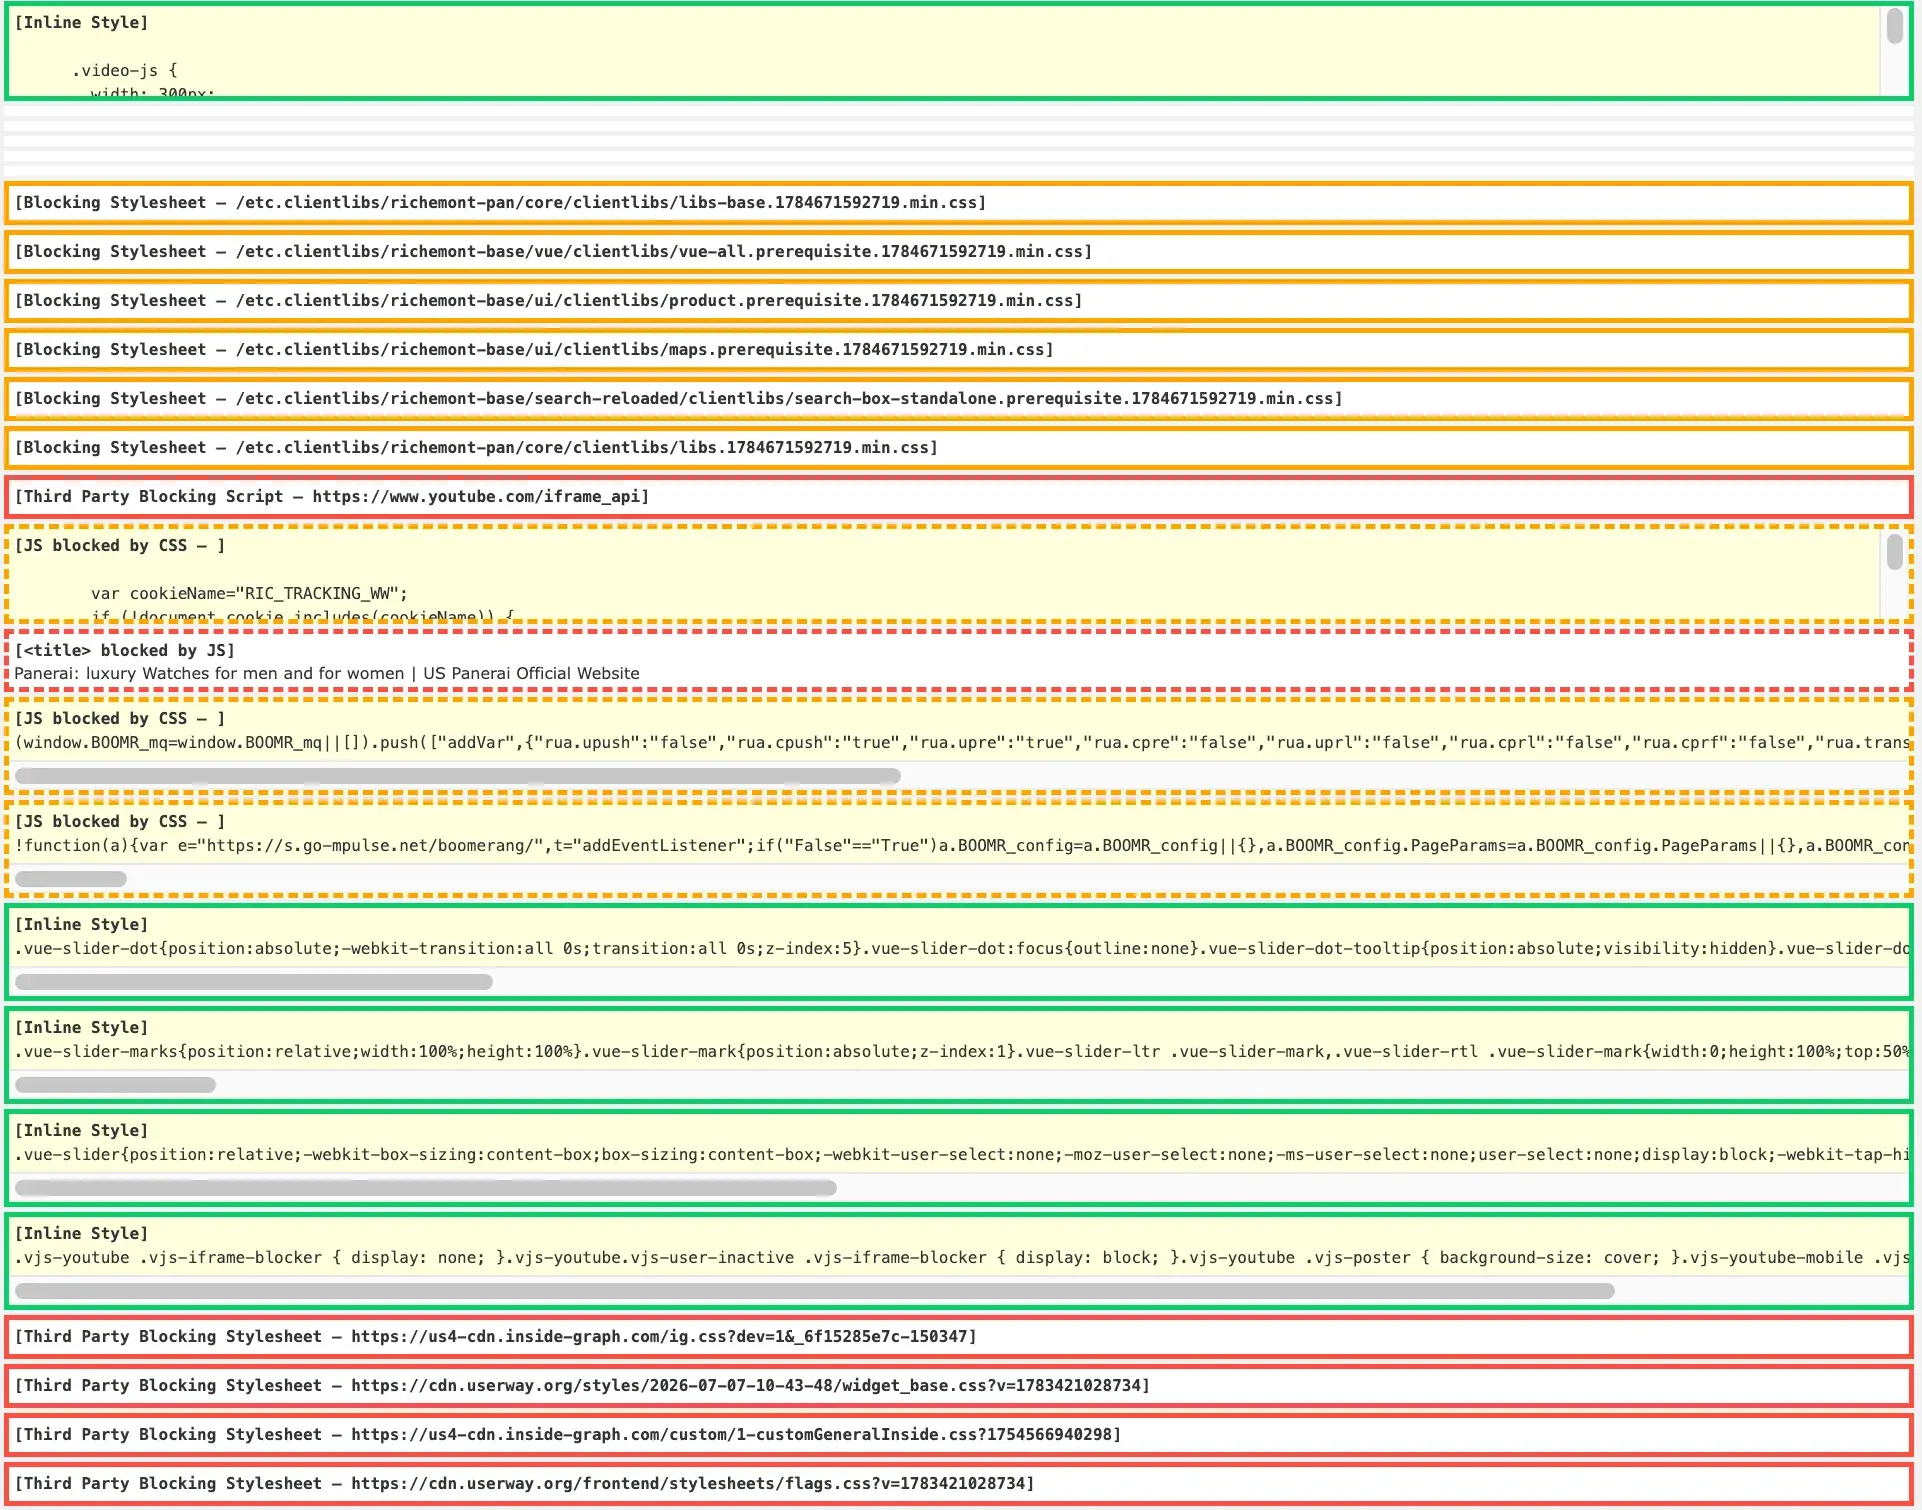
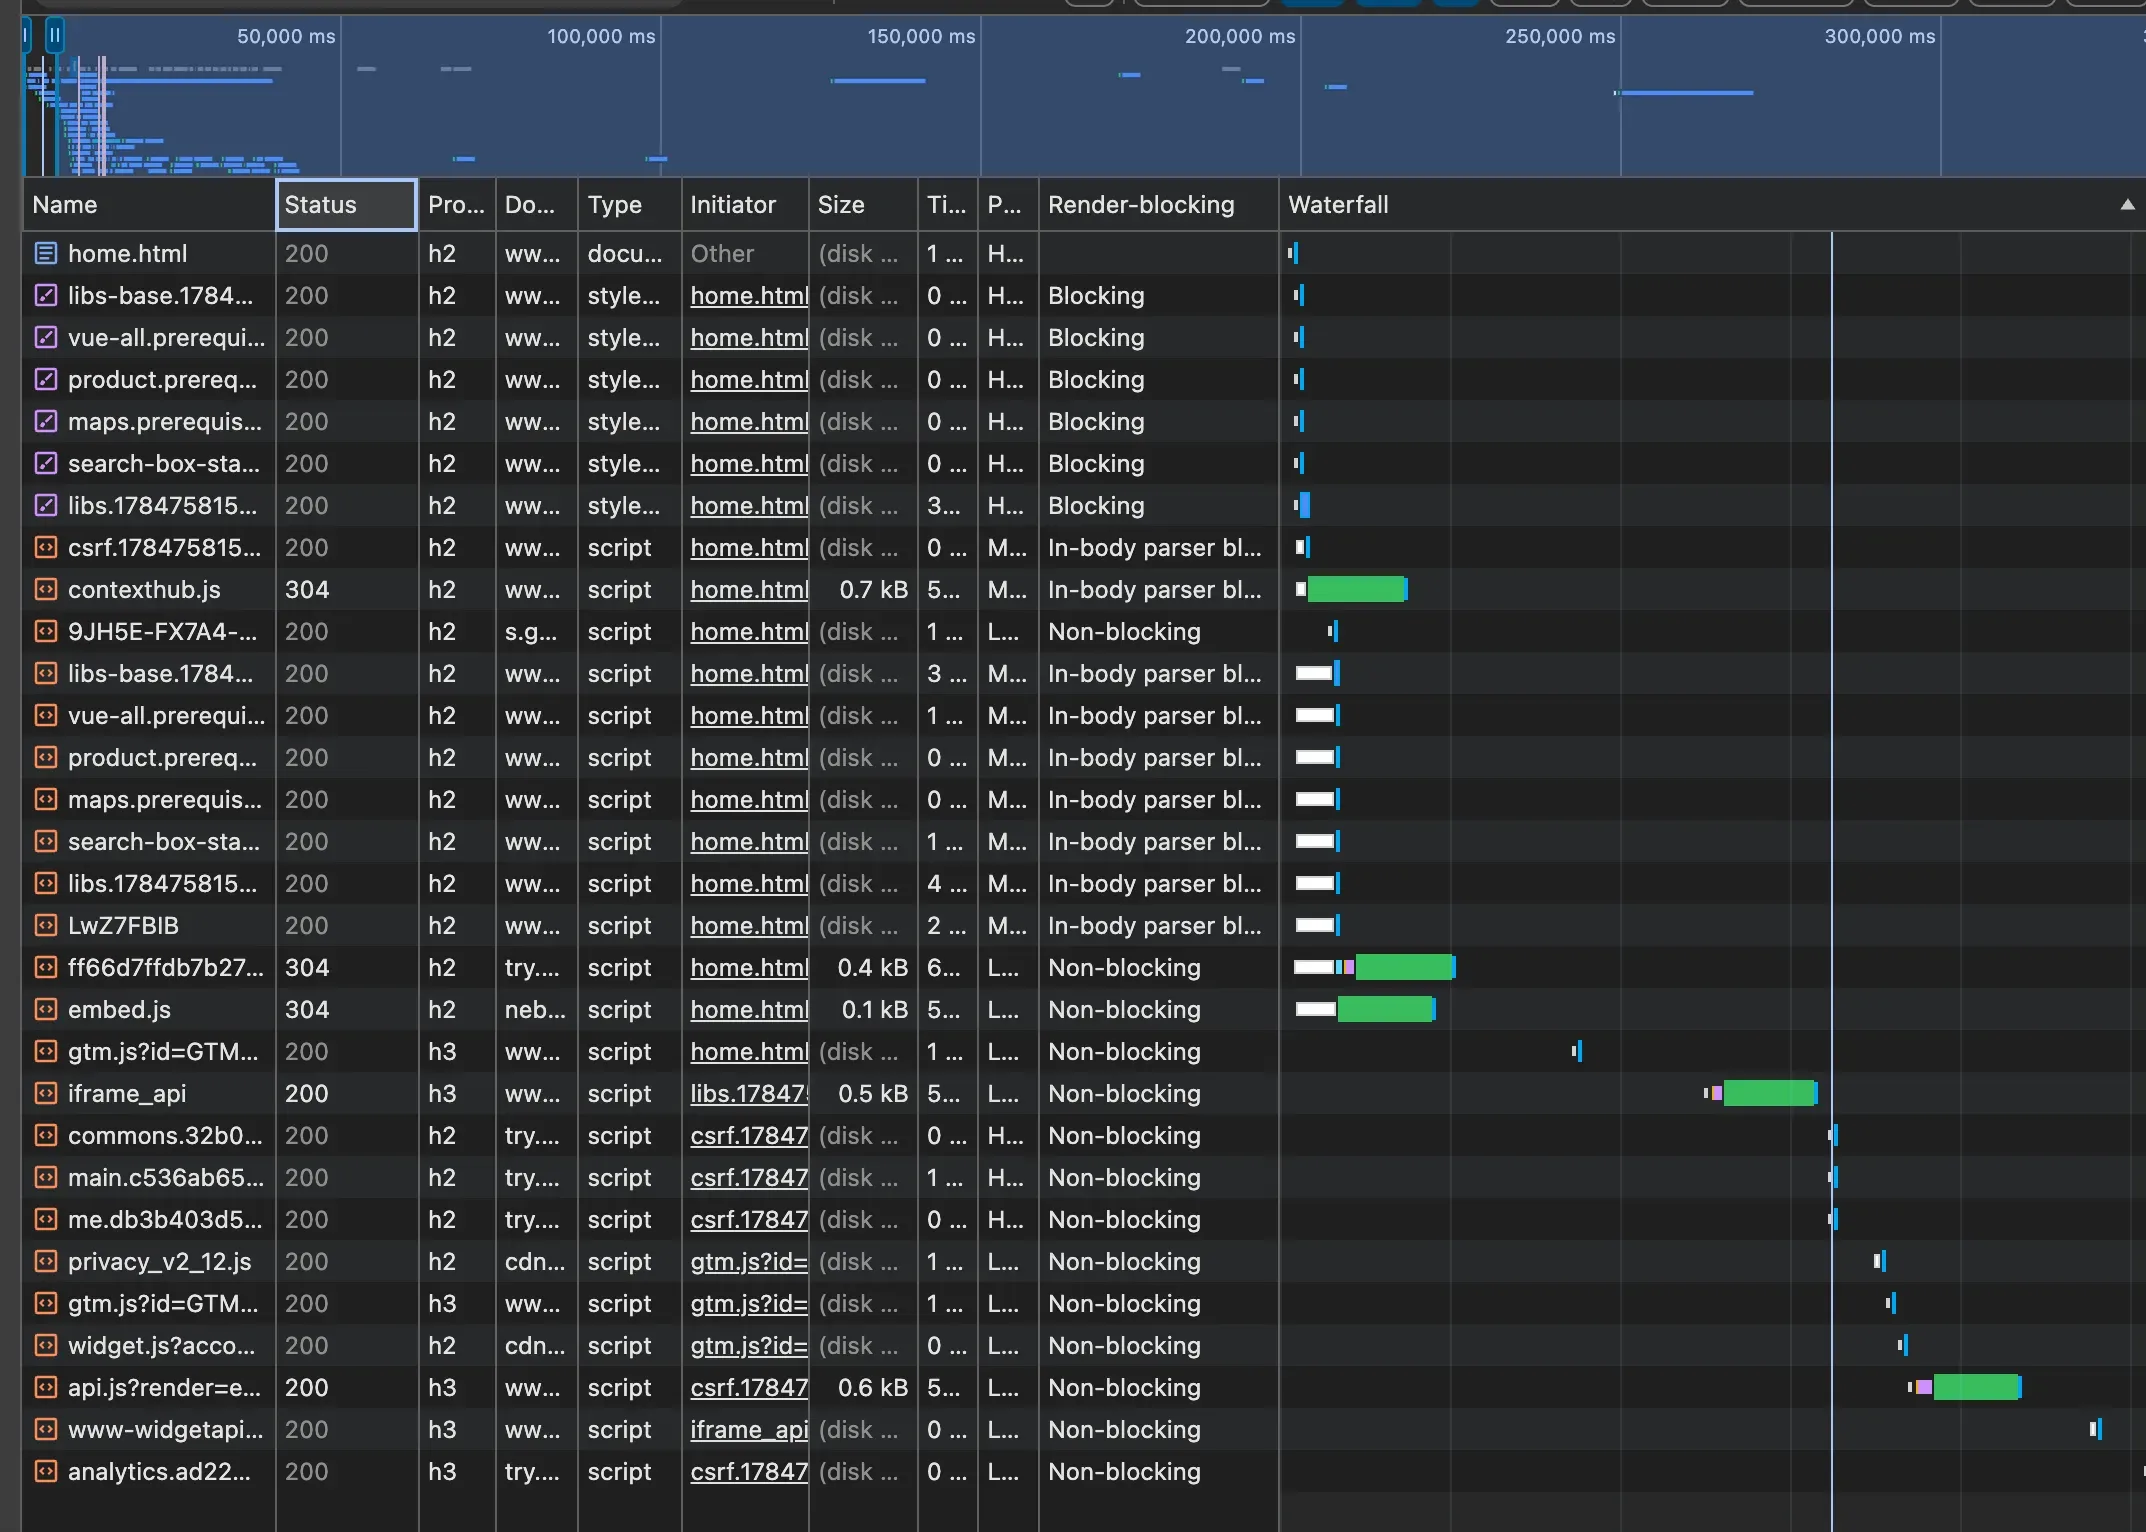
- 6 render-blocking CSS files (Highest priority, “Blocking”) totalling ~300 kB, all initiated from HTML
<head>— largest islibs.min.cssat 273 kB - ~750 kB of in-body parser-blocking JS (
libs-base.min.js223 kB,libs.min.js249 kB,vue-all.prerequisite116 kB, plus a hashed app bundle ~168 kB) withoutasync/defer - YouTube iframe API script present in
<head>— ct.css flags it red as “blocking”, but it’s actually injected at runtime bylibs.min.js(initiator chain: home.html → libs.min.js → youtube.com/iframe_api) and dynamically-created scripts are async by default, so it is not render-blocking. ct.css reads the live DOM and only checks for theasyncattribute, so it overstates this one. Still worth flagging as avoidable third-party cost (network + main-thread) that shouldn’t load on the homepage unless a video is above the fold. <title>blocked by an inline JS snippet placed before it in<head>— malformed head order- LCP image assigned Low priority and JS-initiated (via
libs.min.js) — see LCP finding for the full discovery analysis - TTFB: 592ms lab / 0.9s field (p75) — Needs Improvement
- Cache TTL ~3 weeks on versioned assets — should be 1 year
- 6 render-blocking CSS files (Highest priority, “Blocking”) totalling ~300 kB, all initiated from HTML
- Why it happens: No critical CSS extraction — the full 273 kB stylesheet is required before any render. JS bundles are placed in-body without deferral. The inline snippet before
<title>is a genuine head-order issue; the YouTube script is runtime-injected and async (not blocking, despite ct.css’s red flag) — see note above. - Recommended fix: Extract critical CSS (above-the-fold styles) and inline it; load the rest with the
media="print"lazy-load pattern. Defer or async non-critical JS. Move YouTube iframe API to load on interaction (facade pattern). Fix head element order — no scripts before<title>. SetCache-Control: max-age=31536000, immutableon all versioned static assets. - Estimated impact: High — render-blocking CSS and Low-priority LCP image together explain most of the 12.48s lab LCP.
Bundle / Dead Code
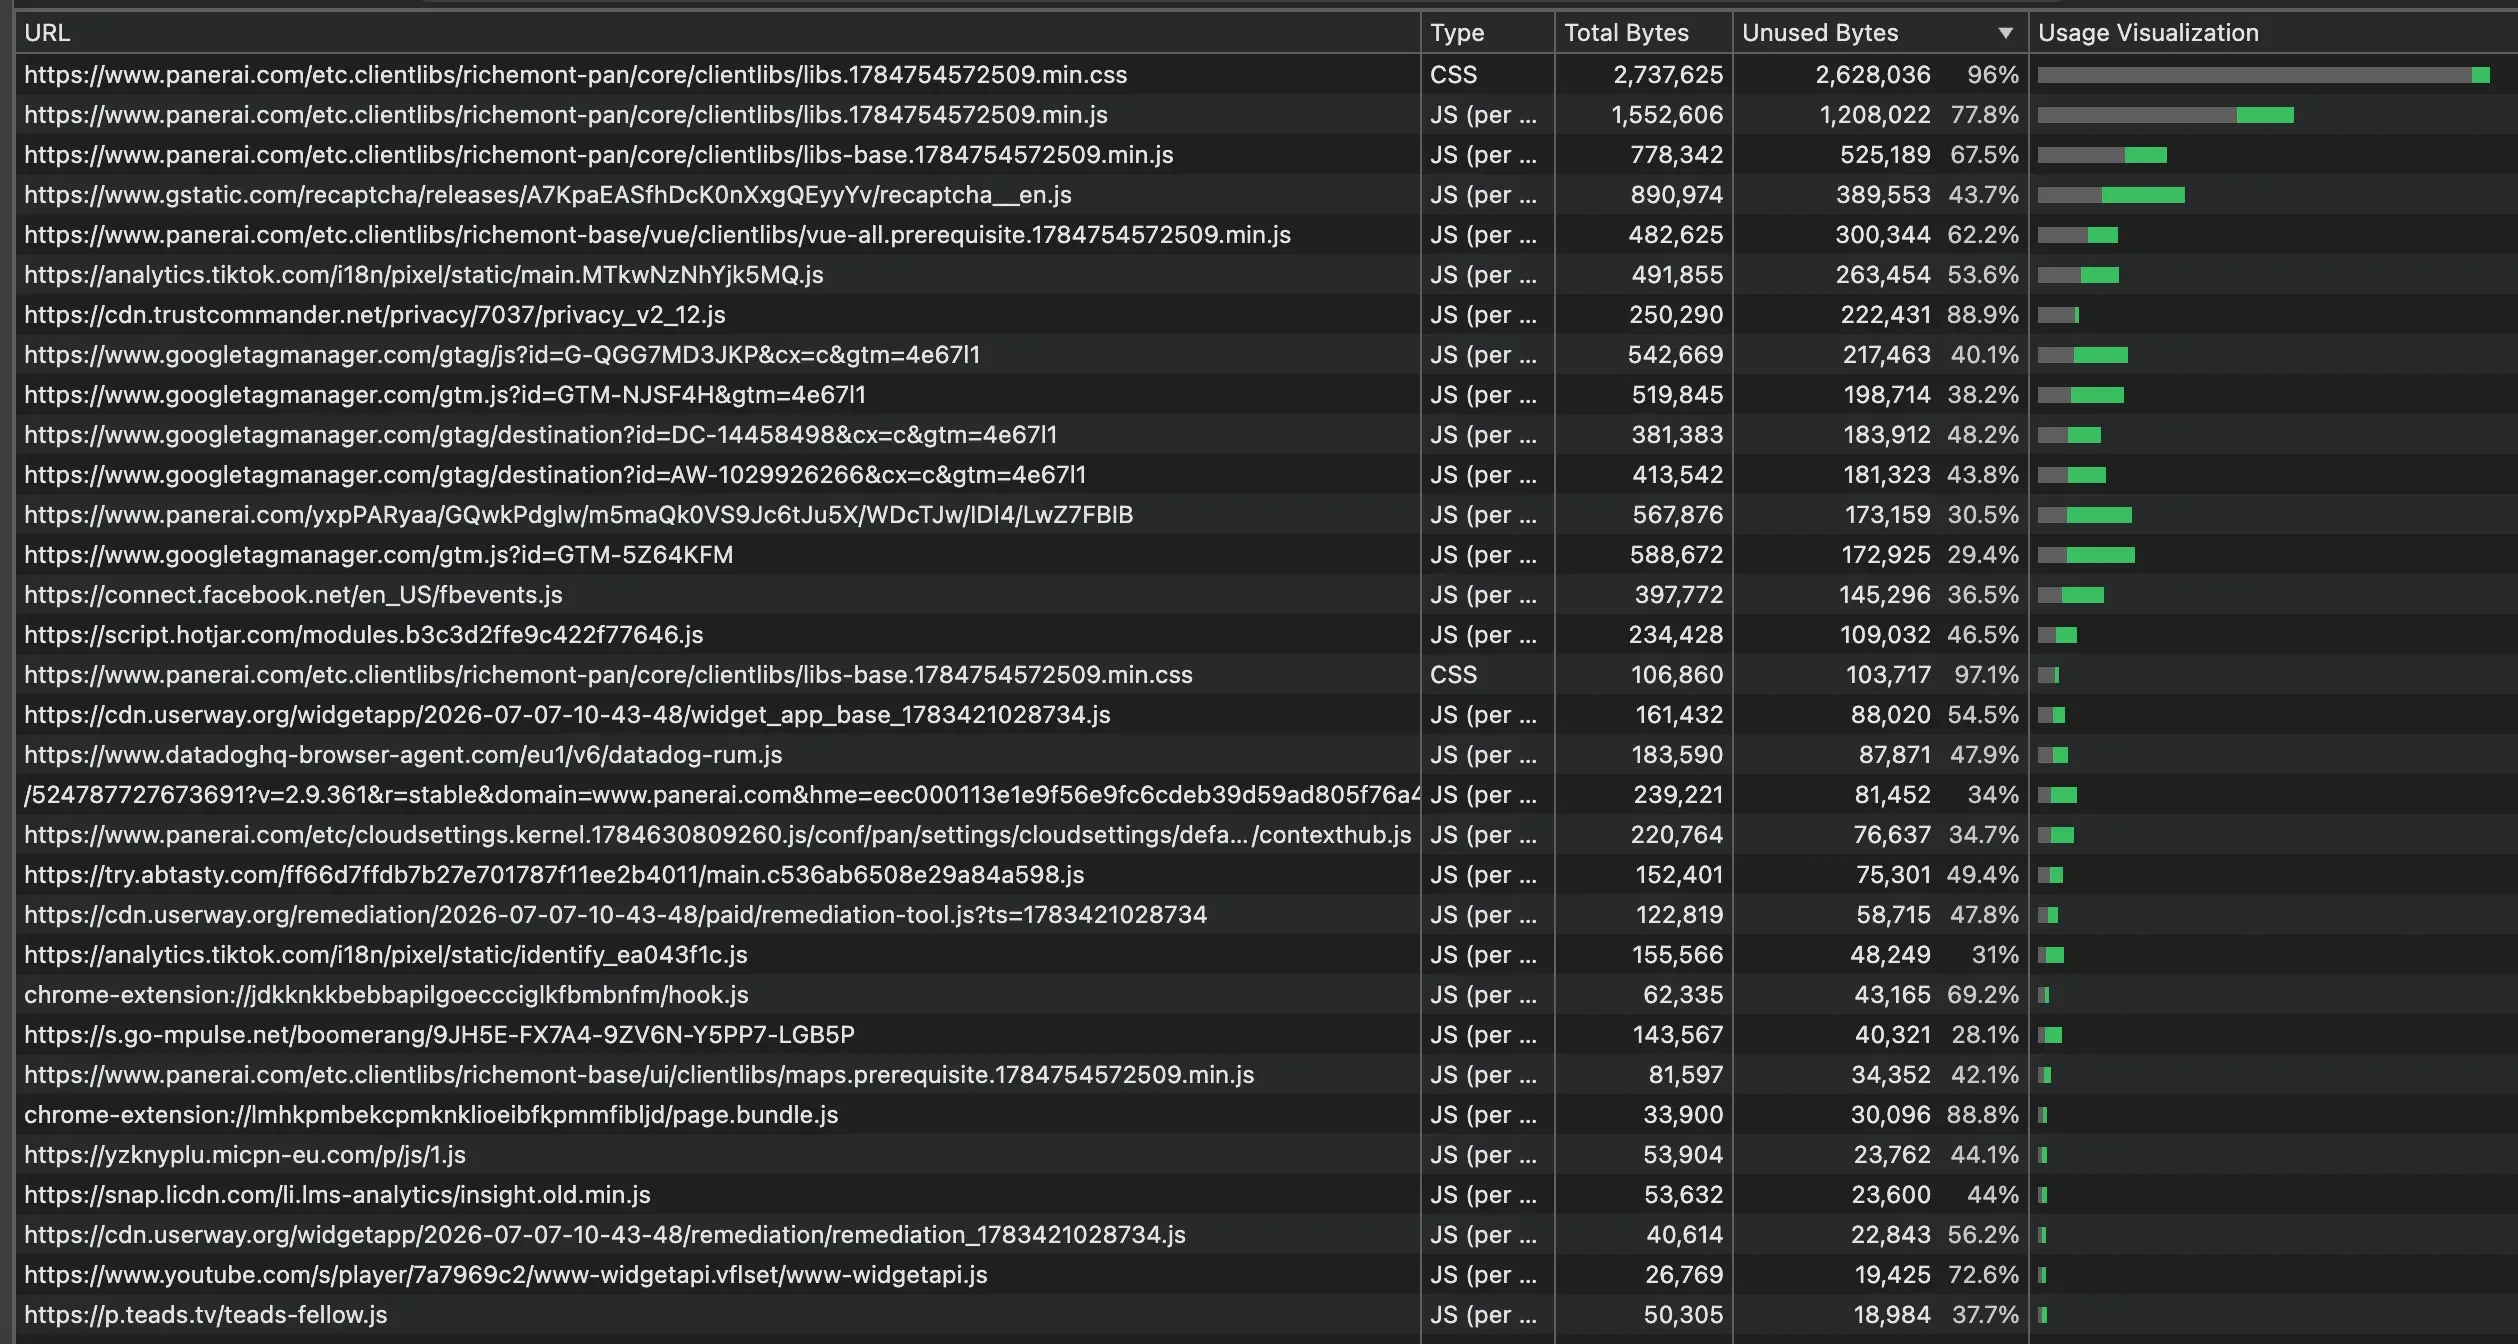
- Unused JS: ~4199 KiB (Lighthouse) ❌ — split roughly 50/50 first-party / third-party
- Unused CSS:
libs.min.cssis 96% unused (2.63 MB of 2.74 MB decoded) ❌ - What I observed:
- CSS is the worst single offender. The Coverage panel shows
libs.min.cssat 96% unused — nearly the entire 2.74 MB (decoded) stylesheet is dead on the homepage.libs-base.min.cssis 97% unused. (Lighthouse’s “198 KiB unused CSS” is the transfer/compressed estimate; Coverage’s 2.63 MB is the decoded parse cost — same waste, different unit. See note.) - Unused JS ~4199 KiB (Lighthouse), which is the same V8 coverage data Lighthouse aggregates. Summing the Coverage rows confirms it, and the split is informative:
- First-party ~2.2 MB unused —
libs.min.js(1.2 MB),libs-base.min.js(525 KB),vue-all.prerequisite(300 KB), a hashed app bundle (~173 KB),contexthub/maps(~110 KB) - Third-party ~2.5 MB unused — GTM (~950 KB across 4 loads), reCAPTCHA (390 KB), TikTok (310 KB), Trustcommander (222 KB), Facebook, Hotjar, UserWay, Datadog, AB Tasty, Boomerang
- First-party ~2.2 MB unused —
- CSS is the worst single offender. The Coverage panel shows
- Why it happens: Two independent problems that need two different fixes:
- First-party — monolithic bundles (
libs.min.js,libs-base.min.js,vue-all) ship code for all pages/components, not just the homepage. No route- or component-level code splitting. - Third-party — a large stack of marketing/analytics tags (GTM loading 4 containers, reCAPTCHA, TikTok, Facebook, etc.) all load upfront on the homepage.
- First-party — monolithic bundles (
- Recommended fix:
- CSS: extract critical CSS and lazy-load the rest (same fix as the Loading/Network finding — the 96%-unused number makes it high-priority, not optional).
- First-party JS: code splitting at route/component level; defer component-specific JS (maps, search, sliders) until in view.
- Third-party JS: audit the tag stack — 4 GTM loads and reCAPTCHA-on-homepage are suspect; facade-load or defer non-critical tags.
- Estimated impact: High — this is the primary driver of TBT 9560ms and feeds INP. The first-party/third-party split means it’s two workstreams: bundle splitting (owned by the dev team) and tag governance (owned by marketing/analytics). The 96%-unused CSS is the single fastest win.
Quick Wins vs. Larger Efforts
Quick wins (low effort, can ship soon)
- Un-lazyload the first hero slide — give it real
src/srcset+fetchpriority="high"so the preload scanner discovers it at T=0 (keep lazyload on other slides) - Fix the existing preload link to match the transformed variant the
<img>actually renders (imagesrcset/imagesizes) — or remove it, since it currently downloads an unused image - Set
Cache-Control: max-age=31536000, immutableon versioned static assets — server/CDN config change - Move YouTube iframe API to load on interaction — replace blocking
<script>in<head>with a facade
Larger efforts (higher effort, plan separately)
- Extract critical CSS and defer the rest —
libs.min.cssis 96% unused on the homepage; split into critical (inlined) and non-critical (lazy-loaded). The fastest high-impact win. - Introduce code splitting for first-party JS — ~2.2 MB unused across
libs.min.js/libs-base.min.js/vue-all; route/component-level splitting; biggest long-term win for TBT and INP - Audit the third-party tag stack — ~2.5 MB unused across GTM (4 loads), reCAPTCHA, TikTok, Facebook, etc.; facade-load or defer non-critical tags (owned by marketing/analytics, not dev)
- Investigate and optimise burger menu event handler — 671ms processing duration needs profiling to identify specific functions causing the delay
- Fix head element order — inline script before
<title>needs restructuring; requires careful regression testing
Notes / Caveats
- Verified 2026-07-22 via chrome-devtools-mcp trace + raw HTML inspection. Confirmed the LCP discovery bug: hero
<img>/<source>usedata-src/data-srcset(JS lazyload), and the<head>preload targets a different URL than the LCP element renders. The hero rotates daily (Luna-Rossa / Luminor), but the pattern is identical across variants. LCP image download is ~0.15ms (cache HIT) — the delay is 100% discovery. - Field CrUX data confirmed current in PSI on 2026-07-22 (LCP 2.9s, INP 262ms, CLS 0.09). These are origin-scope — PSI’s “This URL” tab is disabled, meaning there’s no URL-level CrUX for
/pl/en/home.html, so numbers are aggregated across the origin. The MCP trace reported no URL-scope CrUX for the same reason. - Lab LCP is highly variable run-to-run. At 6x CPU / Slow 4G on 07-24, three runs gave ~8s / ~15s / ~12s (median 12.48s, used in the table). An earlier 07-19 session at the same throttle gave 5.47s; an unthrottled MCP run gave 1.25s. This instability is itself evidence of the discovery bug — because the LCP is gated on when heavyweight JS finishes executing (not on downloading the image), it swings with main-thread congestion and how many third parties fire. A download-bound LCP would be stable. Field CrUX p75 (2.9s) is the reliable baseline; lab numbers are for explaining the cause, not grading.
- LCP lab is the median of 3 runs; INP was reproduced across 4–5 runs; the network/coverage captures are single snapshots.
- The cookie banner also inflates lab LCP when Lighthouse runs without cookies (banner text becomes LCP). This trace was recorded with cookies accepted.
- Coverage numbers are decoded (uncompressed) bytes, not transfer size — that’s why
libs.min.cssreads 2.74 MB in Coverage but ~273 kB in the network waterfall (gzipped). Lighthouse’s “unused” figures are transfer estimates; both are valid, they just measure different stages (network vs. parse).